This project asks one question: was it the chip or the software?
In 2025, Sada et al. published “Serving LLMs in HPC Clusters: A Comparative Study of Qualcomm Cloud AI 100 Ultra and NVIDIA Data Center GPUs”. They served 12 models with vLLM on both platforms and found that the Qualcomm card offers competitive energy efficiency, leads in tokens per second per watt on 3 of 12 models, and can serve models on far less hardware (one 36 W device for an 8B model). It also serves most models at about 6–25 tok/s, which leaves room to grow.
Both sides ran vLLM, so every number measures the chip and its software stack together. I’m re-running the study with Modular’s MAX serving engine alongside vLLM, to measure how much a newer software stack adds. The four hypotheses, written down before any runs, are on the home page. The code and data are at github.com/kredd2506/modlearn. For why I chose this paper and what I read in its numbers, see Chip or software?.
This first post is not about Qualcomm or NVIDIA at all. It’s about testing the stopwatch before timing the race.
Why pilot on a laptop
GPU hours cost money, and Qualcomm access is scarce. A benchmark bug found on rented hardware wastes both, and it’s easy to miss, because a biased measurement still produces a tidy table.
So I built the harness on my MacBook Pro (Apple M4 Pro, 24 GB) first, with MAX 26.6.0 serving SmolLM2-135M-Instruct in bf16 on the Apple GPU. None of the numbers below are comparable to the paper. The model, the hardware, and the power meter are all different. The point was to check the method, and in two places it needed fixing.
The method (copied from the paper)
The paper doesn’t publish its prompts or code, so I rebuilt its protocol from the text:
- Test grid: output lengths of {10, 50, 100, 200, 1024, 2048} tokens × concurrency {1, 2, 4, 16, 32}. Concurrency is how many requests are sent at the same moment. That’s 30 cells, and each cell is repeated 3 times.
- Client: Python
requestsplus aThreadPoolExecutor, one thread per concurrent request, temperature 0, against the server’s OpenAI-compatible endpoint. My 20 fixed prompts are inbench/prompts.jsonl. - Throughput: total generated tokens divided by the slowest request’s completion time in the batch.
- Power: sampled once per second and averaged over the run. The paper used
nvidia-smiandqaic-util. On the Mac I usepowermetrics(itsgpu_powersampler), which reports GPU power only, not the whole machine. - Efficiency: tokens per second per watt (tok/s/W), which is the same thing as tokens per joule. Higher is better.
I also stream the responses, which adds two latency numbers the paper doesn’t report: TTFT (time to first token,
from sending the request to receiving the first token) and ITL (inter-token latency, the average gap between
subsequent tokens). MAX honours ignore_eos, so every request generates exactly its target number of tokens.
The harness is bench/run.py,
bench/client.py, and
bench/power.py.
Aside: getting MAX onto the Mac GPU
Three things I’d want to know up front:
- You need full Xcode, not just the Command Line Tools, plus
xcodebuild -downloadComponent MetalToolchain. Without them, serving fails with “Metal Compiler failed to compile metallib”. CPU serving works without either. - The default KV cache doesn’t fit. MAX tried to allocate 13.3 GB, which is more than Metal’s maximum buffer size
on a 24 GB machine.
--device-memory-utilization 0.5fixed it. - Model support is narrower than vLLM’s. MAX 26.6 has no GPT-2 and no AWQ, and it offers bf16 rather than fp16 for most architectures. The paper used fp16, so bf16 on every engine is a deviation I’ll carry through the project.
First numbers
The final pilot run covered all 90 cells (30 cells × 3 repeats) with no errors, and every request came back at its exact target length. Throughput scales well with concurrency:
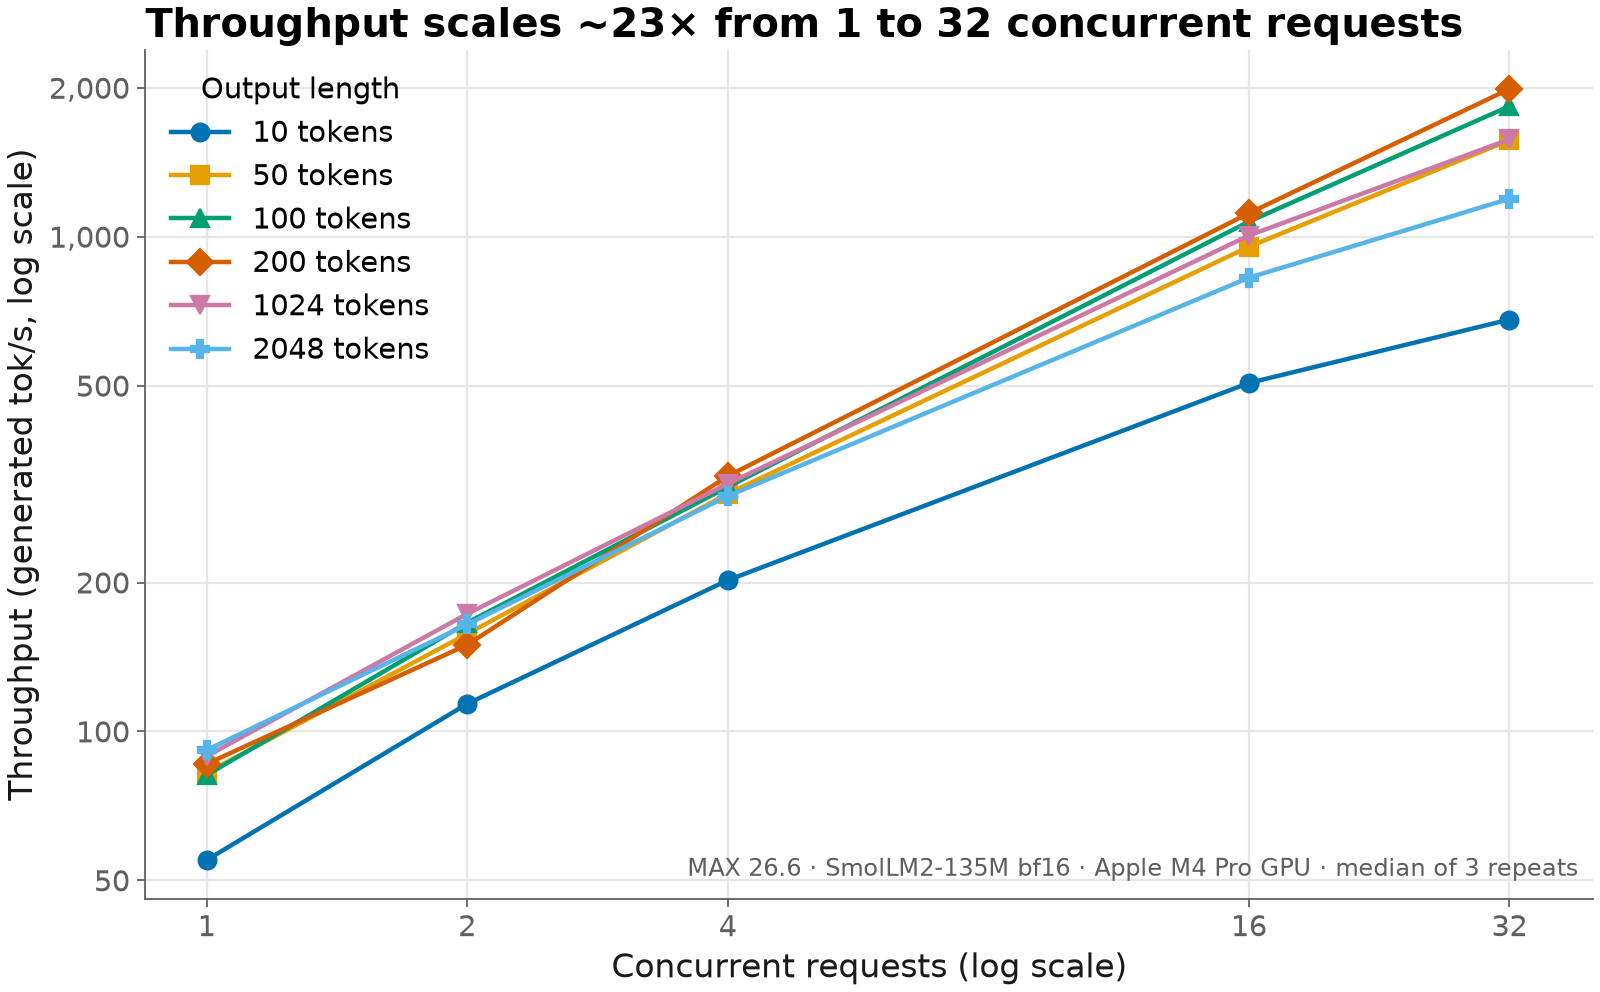
Here is the 200-token row, which contains the paper’s headline cell (200 tokens × 4). Each value is the median over 3 repeats.
| Concurrency | Throughput (tok/s) | GPU power (W) | tok/s/W | TTFT p50 (ms) | ITL (ms) |
|---|---|---|---|---|---|
| 1 | 86 | 4.6 | 19.5 | 67 | 11.0 |
| 2 | 150 | 8.1 | 18.7 | 160 | 12.6 |
| 4 | 328 | 8.9 | 35.6 | 71 | 11.5 |
| 16 | 1,116 | 10.2 | 108.1 | 297 | 12.8 |
| 32 | 1,990 | 12.6 | 158.5 | 404 | 14.2 |
From concurrency 1 to 32, throughput grows about 23× while GPU power grows less than 3×, so efficiency peaks at about 158 tok/s/W at 200 × 32. That’s the best cell in the grid. With the model loaded and no requests, the GPU draws essentially nothing (0.07 W), because it power-gates: it switches itself off when idle.
One thing I didn’t expect: efficiency dips at concurrency 2. At every output length, tok/s/W at concurrency 2 is 3–30% lower than at 1. Throughput roughly doubles, but GPU power more than doubles, from about 3.5 W to about 8 W at the short lengths. My guess is that a second request pushes the GPU into a higher clock or power state, but I haven’t tested that, so treat it as an observation rather than an explanation.
Full grids are in
results/pilot-mac-smollm2-135m-minwin5-cells.csv.
Finding 1: short batches make power look too good
My first full run produced a strange efficiency grid. The best tok/s/W at concurrency 1 came from the shortest outputs: 201 tok/s/W at 10 tokens, versus 19 at 2048. Nothing about generating fewer tokens should make a GPU ten times more efficient.
The cause was the measurement window. A 10-token batch at concurrency 1 finishes in about 0.18 s (about 0.35 s
if the GPU first has to wake up; see finding 2), but each
powermetrics sample covers 1 s. The Apple GPU power-gates to about 0 W between bursts, so each sample averaged a
short burst of work with a long stretch of idle. The reported power came out far too low, and efficiency far too
high.
The fix was simple: repeat each cell’s batch back to back until the measurement window lasts at least 5 s
(min_window_s = 5 in the runner). A 10-token cell now runs 11–30 batches, while a 2048-token cell still runs once.
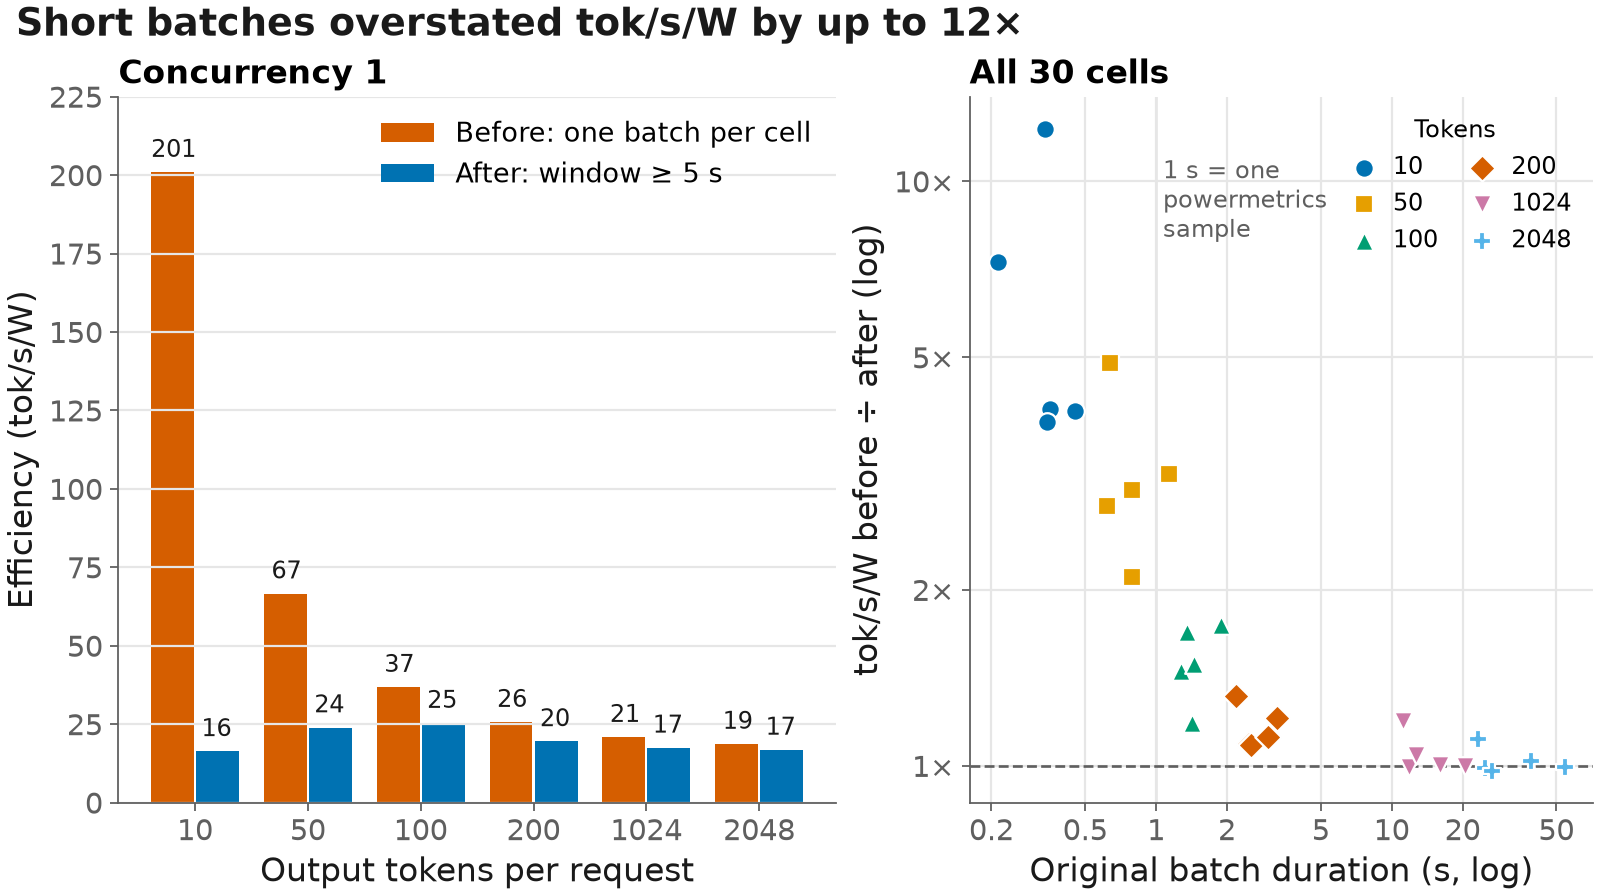
How much a cell moved depends on how long its original batch lasted. Sub-second cells were overstated by 2–12×. Cells that already lasted 10 s or more should not move, and at concurrency 2–32 the 1024- and 2048-token cells match the first run within 5%. The two concurrency-1 cells moved more: tok/s/W fell 16% (1024) and 10% (2048). I don’t have a clean explanation for those. The 2048 × 1 repeats already spread from 16 to 22 tok/s/W within each run, so I read it as noise rather than bias, but I’ll watch for it on the A100.
The measurements also got steadier. The coefficient of variation of tok/s/W across repeats (standard deviation over mean) fell from a median of 9.5% (worst 141%) to 5.5% (worst 29%).
Why this matters for the paper: it also sampled power once per second with nvidia-smi, and its short cells
(10 and 50 tokens) can finish in well under a second. An A100 doesn’t idle near 0 W the way an Apple GPU does, so the
effect there would be smaller, and I can’t tell from the paper how its windows were set up. So I’m not claiming the
paper’s numbers are wrong. It’s a plausible exposure that I’ll avoid by design, and one I can test directly on an
A100.
Finding 2: the bimodal TTFT was the GPU waking up
The TTFT numbers fell into two groups, around 65 ms and around 250 ms, with little in between. The slow ones weren’t tied to particular prompts or prompt lengths. They were almost all in the first batch of each cell, right after the runner had paused to collect power samples.
That suggested the GPU was falling asleep between cells. To test it, I sent single requests after controlled idle
gaps of 0 to 5 s, 8 rounds per gap, to MAX on the GPU and to MAX on the CPU as a control
(results/ttft-gap-mac.csv):
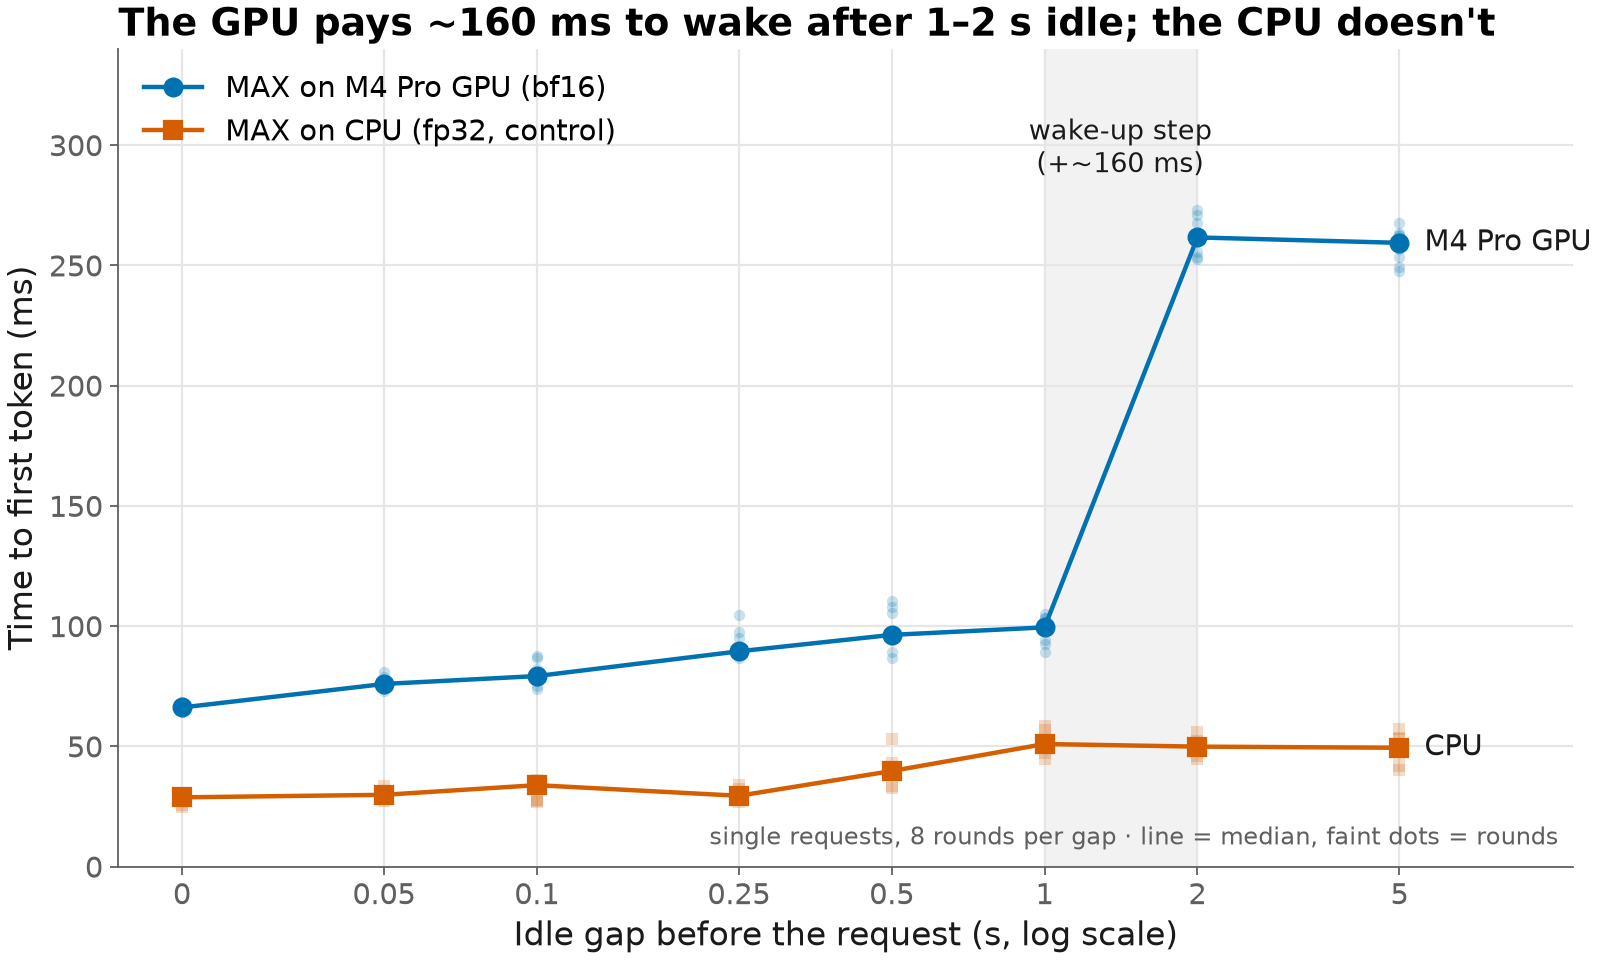
Between 1 s and 2 s of idle, GPU TTFT jumps by about 160 ms, from 100 ms to 262 ms. The CPU shows no step, only a gentle drift of about 20 ms as the gap grows (the GPU drifts a little more before its step), likely from scheduling or CPU power states. A cost that appears only on the GPU, and only after a second or two of idle, fits the GPU waking from power-gating, the same behaviour behind the ~0 W idle reading.
The fix is one unmeasured “prewarm” request just before each cell starts. In a check with 2.5 s of idle between cells, it brought the median first-batch TTFT from 217 ms down to 67 ms. This is the faithful choice, not a cosmetic one, because the paper reports steady-state serving, not cold starts. (The runs in this post predate the prewarm, so cells with only one or two batches, such as 200 × 2 in the table above, still carry some wake-up TTFT.)
Finding 3: my client agrees with Modular’s benchmark tool
A homemade client needs an outside reference, so I ran MAX’s own max benchmark against the same server with
200-token outputs
(c=4,
c=32):
| Concurrency | Metric | My client | max benchmark |
|---|---|---|---|
| 4 | Throughput | 328 tok/s | 324 tok/s |
| 4 | TTFT p50 / mean ITL | 71 / 11.5 ms | 72 / 11.9 ms |
| 32 | Throughput | 1,990 tok/s | 1,968 tok/s |
| 32 | TTFT p50 / mean ITL | 404 / 14.2 ms | 325 / 13.9 ms |
Throughput and ITL agree within 1–3%. TTFT at 32 differs by design. My client releases all 32 requests at once, as
the paper did, so they queue for prefill together. max benchmark keeps 32 requests in flight on a rolling basis,
so their arrivals are staggered.
Two details if you use max benchmark yourself. First, its “Output throughput” row is a per-request figure, not the
server’s aggregate throughput, so I computed total output tokens divided by duration. Second, its random dataset
doesn’t force the output length (these runs ranged from 9 to 242 tokens).
What this does and doesn’t show
It shows that the harness measures what I think it measures: exact output lengths, throughput that matches an independent tool, power windows long enough to trust, and latency measured warm.
It doesn’t tell you anything about Qualcomm vs NVIDIA:
- SmolLM2-135M is a toy. The paper’s models are much larger, and a 135M model is dominated by per-request and per-step overheads that matter far less at that scale.
- An Apple GPU is not an A100. It has a different memory system, different power management, and different kernels inside MAX.
powermetricsGPU power is not board power.nvidia-smireports the whole card, including memory. On the Mac, the unified memory and the CPU running the server aren’t counted.- bf16, not fp16, as noted above.
What’s next
- A100: vLLM vs MAX on the paper’s grid, using NVML’s energy counter alongside 1 s sampling. That tests H2 and H3, and whether 1 s sampling biases the paper’s short cells on real data-center hardware.
- Qualcomm Cloud AI 100 Ultra access, for H1. That’s the question that started this.
- GPT-2 in MAX. MAX 26.6 doesn’t support GPT-2, so it can’t serve every model on the paper’s list as-is. Writing that architecture myself is also a good way to learn the MAX graph API.
Every setting and every result file from this pilot is in
results/, with the caveats in its
README. The figures come from
analysis/plot_pilot.py.